What is Power BI?
Designed to help your organisation become more data-driven, Power BI is one of the most powerful tools for business intelligence. Customised, visual dashboards can be created with Power BI’s intuitive drag-and-drop feature, and reports can be published fast and easily.
Who uses Microsoft Power BI?
When we looked at the users of Microsoft Power BI based on their industry, we discovered that the top three industries with the most customers are Professional Services (16.8 percent), Manufacturing (12.8 percent), and Banking and Financial Services (8.8 percent).
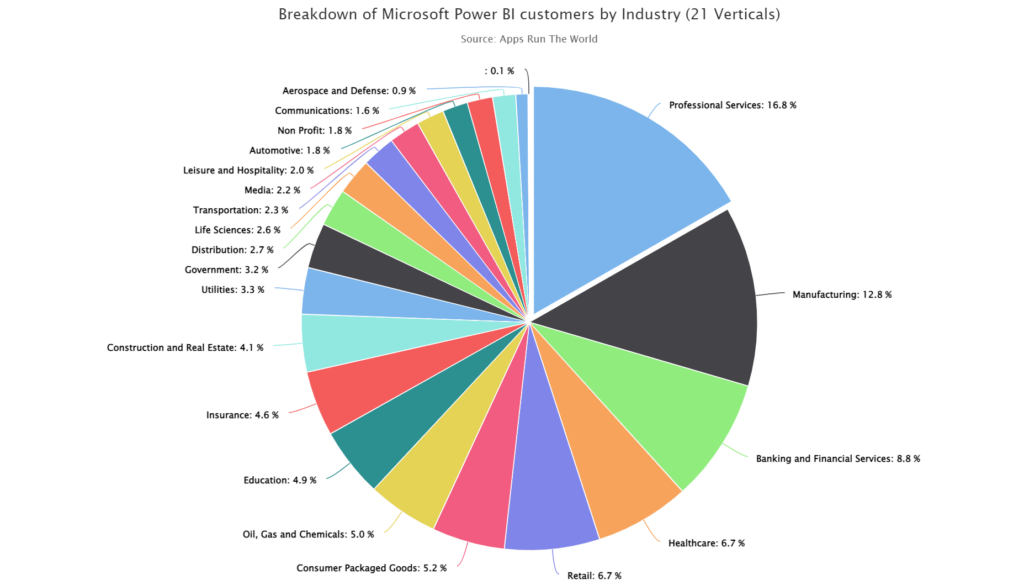
When it comes to the top countries where Power BI is used, the United States ranks first with 73.3 % of clients, followed by Canada with 10.1% and United Kingdom with 6.7%. Furthermore, of all Power BI users, 24 % are small businesses (with less than 50 workers), 42.1 % medium-sized businesses, and 33.8 % are large businesses (with more than 1000 employees).
How do big companies do it?
According to market share data, Nestlé is the world’s largest manufacturer of food and beverage goods. Data from the company’s central data warehouse needed to be combined with information from its local databases. Therefore a cloud-based data warehouse was created. For Nestle’s long-term benefit, Microsoft Azure and Power BI were adopted.
For an organisation of this size, finding and managing the right tools for employees to make smart business decisions is both critical and difficult. Nestlé began adopting Microsoft Power BI in 2018. It provided executives access to real-time, on-demand data without having to wait for reports from the company’s central BI department.
It’s also worth mentioning that Nestlé has a long history of bringing in highly qualified data scientists, analysts, and IT specialists. As the speed of change accelerates, Nestlé has an advantage because it can adapt quickly to the market.
A large company like Nestlé presents a challenge in scaling data throughout the organisation while yet allowing for rapid market reaction times. A central data warehouse was built by the company because of this. With the help of this centralised data and local information, better decision-making and organic growth were achievable. It is Nestlé’s goal to improve self-service BI capabilities so that the company can remain competitive while also providing its employees with up-to-date data in a convenient manner.
Building blocks for successful BI
Strategic revenue management, marketing and customer segmentation all fall under the remit of Nestlé’s analytical solutions and services.
The analytics technology stack at Nestlé consists of four areas. Components from these areas are the building blocks for successful analytical solutions:
- BI tools
- Machine learning and statistical platforms
- Data management solutions
- Data governance and integration
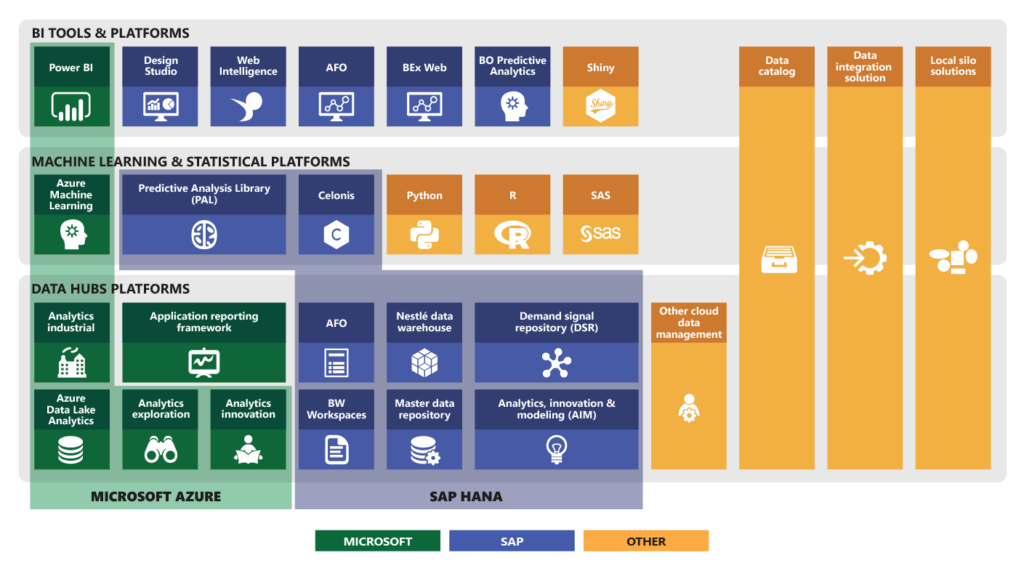
Power BI and SAP BusinessObjects are used by the corporation for its business intelligence (BI) needs. Power BI was picked by Nestle because of its user-friendly interface and minimal learning curve for individuals who are new to BI technology.
Because of Nestlé’s shift to the cloud, previously inconceivable business use cases are now available. Moving to the cloud offers a solution that is more scalable, efficient, and on the cutting-edge of technology. Two of the most crucial components of these new possibilities are statistical platforms and machine learning. With three years under its belt, the Nestlé data and analytics centre now boasts a staff of data and analytics experts.
Power BI’s AI functionalities are also being used by Nestle employees. Q&A has been used to generate dashboard data by allowing users to ask questions in natural language. Nestlé also makes use of AI visuals and Power BI rapid insights to find patterns in the data they collect.
Making data-driven decisions
A growing number of businesses are turning to cloud-based data management systems. Such an alternative to traditional data warehouses is Microsoft Azure. After carefully selecting which Azure technologies to deploy, Nestlé installed an R server on Azure to develop machine learning models. When it comes to data governance, analytics, and storage, Nestlé is taking a step-by-step approach to investing in Azure technology.
Power BI Desktop was initially available to everyone at Nestlé. Employees have access to the tool’s networking, modelling, and visualisation features.
Nestlé then conducted an evaluation of the cloud-based service’s compliance and made Power BI Pro available to a test group of around 700 people to make it easier for corporate users to create and share Power BI content. During the test time, Nestlé additionally implemented Power BI Premium and three international corporate gateways. Subsequently, Power BI was made available to all Nestlé staff across the world. Since then, the company’s user base has grown to over 45,000 monthly active users. Self-service BI is being implemented in stages at Nestlé. The slow adoption of Power BI is helping to establish a long-term solution.With the goal of assisting the company’s pet food brand Nestlé Purina PetCare with crucial business decisions, a dashboard-style marketing tool was developed to offer crucial business and brand performance statistics.
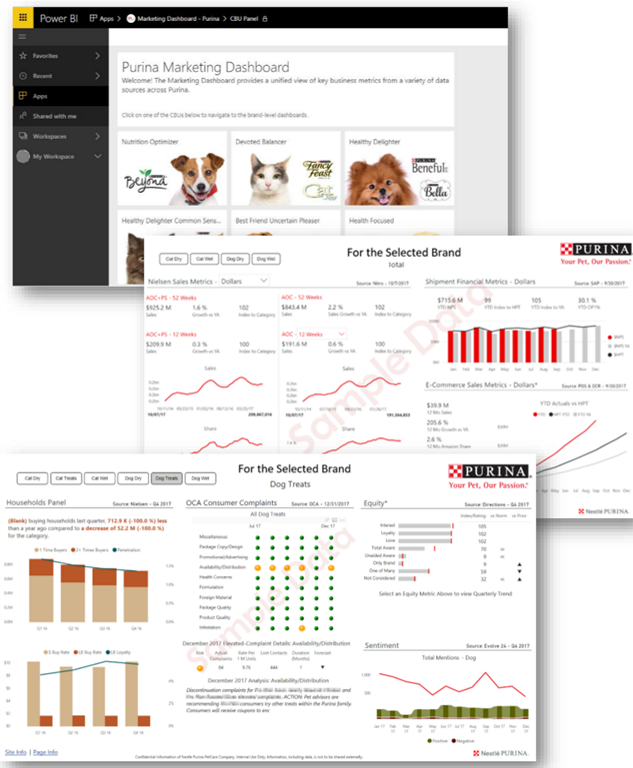
Purina’s dashboard aggregates data from several sources, including Nielsen, custom research, syndicated sales sources, social media channels, and ports of sale (POS).
Balancing continuity with change
Investments in cutting-edge technology are helping Nestlé to stay relevant by empowering its employees and creating a modern and sophisticated business. The company is also utilising Power BI and Azure to gather even more data.
When data can be perceived as a whole, rather than as a collection of discrete elements, business users are able to make more rapid and informed decisions.
In 2021, Nestle improved the access to SAP data warehouse and made Power BI dashboards quicker. Analytic tools are also being developed to make use of Azure’s expanded analytical capabilities.
For Nestlé’s long-term success, it took discipline and bold actions to strike a balance between continuity and change. Nestlé is always re-evaluating its product range and re-engineering its processes to stay up to date with evolving customer expectations while remaining true to its purpose and core values.
You can read more successful client stories and how we made their data simpler with Power BI here.
Read the full Nestlé case study on Microsoft’s page here.