

Business competitiveness is increasingly about versatility, efficiency and innovation. Every business process should be subject to regular review to ensure that operators are being as efficient as they can.

How to Get More From Excel
Excel spreadsheet users, from administrators to Board members should be able to get more from their data sets in Excel faster and easily. There are various aspects to making business processes with Excel slicker. Here are just some of them.
- “Time is money”, so navigating your data quickly to access relevant information is essential to obtaining insights at a glance. This means knowing your keyboard shortcuts, for instance, of which there are hundreds. F7, for instance helps spell check selected text, whilst CTRL and arrows help you move quickly through rows, columns and even data sheets. Inputting dates quickly can be as simple as simultaneously pressing, CTRL, SHIFT and #.
- Pro data entry with Flash Fill takes the grind out of what can be mind-numbing work that is subject to human error. Even importing can bring in errors, let alone manually typing each value. This Excel feature notes the nature of information you have already inputted, then suggest values for subsequent fields. This is great for repeated text, such as e.g. dates, text or even names. This last example is particularly clever for creating contact sheets, when you have filled in email addresses. When you start a new column for e.g. surnames, Flash Fill can examine the list of email addresses and suggest the names for you, speeding up your database development.
- Visual representations of data allow for meaningful insights into huge bodies of data in seconds and ease communications, regardless of Excel expertise. Pie and bar charts have been around for years and are useful, but since 2016, Excel designers have upped their game. New data visualisations make your spreadsheets really sell you as the professional.
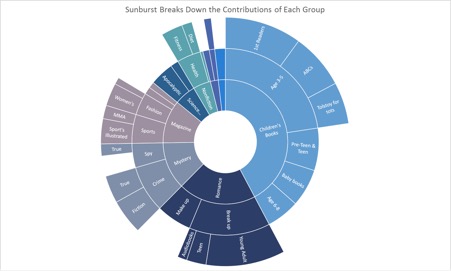
Hierarchical charts show how categories combine to form a whole. Excel’s new Treemap feature is a giant square, representing 100% of the values. This is full of rectangles, representing elements of the whole. The Sunburst has a similar function, but it’s round showing how each variable contributes to particular categories within the whole business operation. See below, for instance.
Both chart formats illustrate how categories and sub-categories add value to the bigger picture and even how smaller parts or functions within those sectors contribute.
Microsoft Excel’s other chart format is the waterfall. With a simple click from the INSERT>CHARTS menu, you can show different types of information with your data. It’s shows you flow and contributions to a total, which is so useful for financial data, for instance, but could just as well be adopted for e.g. marketing campaigns.
- Anticipation is the name of the game where business is not just about survival, but about thriving competitively. Excel allows business owners and strategists to look ahead with simple ‘Forecasting’ functionality. Whether to harness Big Data, or develop projects from relatively small spreadsheets of past data, Excel allows you to look ahead and make more evidence based projections and investments.
Financial Modelling
Since Excel’s 2016 roll out, users can select table columns and make different projections as to how the results will play out in the future, according to your parameters. Displayed information is either as a line or bar chart. According to Time Magazine, “Excel will even calculate lower and upper confidence bounds (based on a programmable confidence interval) to show the possible margin of error.”
This is a tool you can tweak and tune to suit your requirements, projecting for viability of future investments, or seasonality of revenues, for instance. Financial Modelling is a key aspect of planning and development. Robust financial models inspire confidence in your decision making and help future proof your business. Smart, streamlined financial models, help you anticipate all scenarios and stress-test your projections to build robustness for whatever lies ahead. Not only can this help you plan budgets, good forecasting can help you secure inward investment to help you grow.
Automated financial modelling, ranging from simple cash flow projections, through balance sheets, profit and loss and cash flow statement summaries are all possible with thorough understanding of Excel functionality.
There are so many functions to Excel that are under-utilised. If you ever wonder if you could be getting more from your Excel spreadsheets for data inputting, analysis or presentation, chances are your question is well-founded and it’s time to seek some expert support.
Find out more about the services that Bespoke Excel provide, get in touch with our team of expert data security consultants today on 0161 883 2655.

