Get a callback from our team within 20 minutes during business hours.

Okay, we’ve chatted about Power BI time and time again – you’re probably well familiar with its incredible features by now.
But just in case you need to hear it from the horse’s mouth, our Business Development Director, Jordan Brookes, is here to share his seven key reasons why you should adopt the Power BI platform.
Always keen to leverage the newest technology to stay ahead of the curve, Jordan is a fan of Power BI for enabling us to better serve our clients. Here’s how using it could help you do the same…
With all your data in one place, Power BI has the power to unlock invaluable insights about your business – from monitoring product sales to finding gaps in organisational processes.
By compiling all your data from various platforms and channels and turning it into easy-to-read, intuitive visualisations, all employees on every level will be able to make data-led, impactful decisions. Because Power BI is so easy to use, it doesn’t require a data analyst or an IT professional to access and manage it, meaning everyone within the business can feel empowered and closer to the heart of the action.
Getting started with Power BI dashboards is quick and uncomplicated, meaning there’s no waiting around to see that precious ROI.
For example, all of your data sources can be connected to Power BI in less than a minute, meaning there’s no lengthy set-up process. With in-built integrations such as Excel, Salesforce, Google Analytics, Jira and much more, you can have all your data in one place from the get-go.
When it comes to getting individual users set up, Power BI makes it easy to set up user levels and access permissions, so long as you have a good idea of your data governance strategy ahead of time. And thanks to its incredibly intuitive dashboard and drag-and-drop interface, almost anyone can start using Power BI straight away, without the need for additional training beforehand. If they get stuck, all of Power BI’s educational resources are available for free.
Power BI’s dashboards can be accessed from any laptop, tablet or phone, meaning you can keep your eye on emerging trends wherever you are. This also helps to keep employees in the loop, with the option to share with team-mates or clients on the move.
If you’re concerned about the security risks of accessing sensitive data over a mobile connection, know that the Power BI mobile app comes with full Enterprise Mobility and Security compatibility, meaning you can rest easy knowing your company information stays safe. You also have the option of using Power BI’s flexible permission controls, so only those who need to know certain information can access it from their mobile devices.
Part of the beauty of Power BI is that data sources can be pushed into dashboards in real-time, meaning users can make meaningful decisions based on the most accurate data.
This is incredibly important for conserving time and resources, as out-of-date, inaccurate, or missing data can mean employees need to go searching for the right data before they can move forward. It also enables employees to act quickly within periods of pressure or high demand, limiting the possibility of making decisions that could do more harm than good.
Gone are the days when data needs to be manually downloaded, before reuploading it to another platform in order to be cleaned, processed or visualised. Power BI does this all in one go by staying permanently connected to your data sources, meaning you’ll never have to download a dataset again.
Simply jump in, see your data in real-time and start discovering its potential.
Power BI comes with no upfront costs, so you can get started using Power BI desktop directly without any obligation or license fees. This means you can take your time finding your feet and creating your first report, seeing how Power BI could benefit your business before making a commitment.
If and when you’re ready to level up, know that Power BI Pro still costs two to three times less than its leading competitors, with the option to add additional data capacity without purchasing extra license fees (if over 1000 users).
For more advanced users, Power BI can be used to streamline various processes with its artificial intelligence features. These include image recognition, text analytics and machine learning integration directly from within the platform.
All these new AI capabilities were pioneered in Azure and require no code, enabling all Power BI users to discover hidden, actionable insights in their data and drive better business outcomes.
At Bespoke, we help businesses like yours unlock the full potential of their data through custom solutions, including Microsoft Power BI. Talk to the team today to learn more about Power BI and how we can help you with one of our friendly Power BI consultants.
To those less in-the-know, data can easily come off as being quite a dry subject. Numbers? Graphs? Comparisons? Without the tools to understand or manage data’s complexities, it can all seem a little overwhelming.
But when you have the power to unlock the stories data tells, it opens up a whole door of exciting narratives and intriguing discoveries. And the data can be about anything – from your favourite TV show to how you like to organise your spending.
Here at Bespoke, we’ve been having some fun with data lately. Take a look at the three Power BI dashboard examples below created with Microsoft Power BI, which share some pretty thrilling insights…
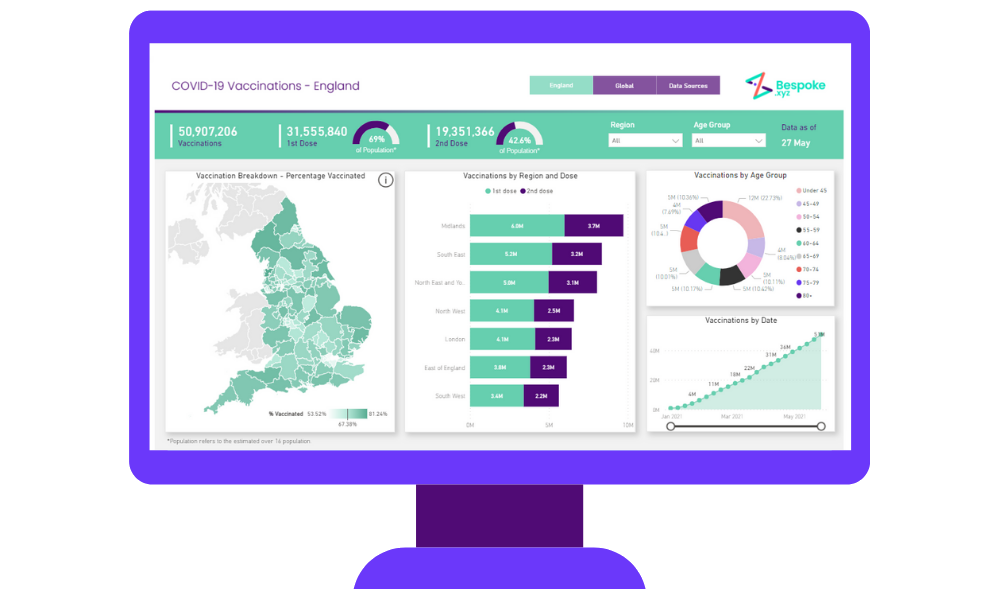
We’re sure you’ll agree that everyone is keeping a close eye on the UK’s covid-19 vaccination rollout right now. We decided to compile all the current stats on vaccinations in this easy-to-view Power BI dashboard, so you can stay close to the action as it unfolds.
The map on the left gives a top-down view of the most vaccinated areas in the UK, while the filters in the top right enable you to check the progress of vaccinations in your local area and by age.
Flip on over to the second page and we can compare the UK’s progress with the rest of the world, checking out the most vaccinated countries and seeing the number of vaccination doses administered so far.
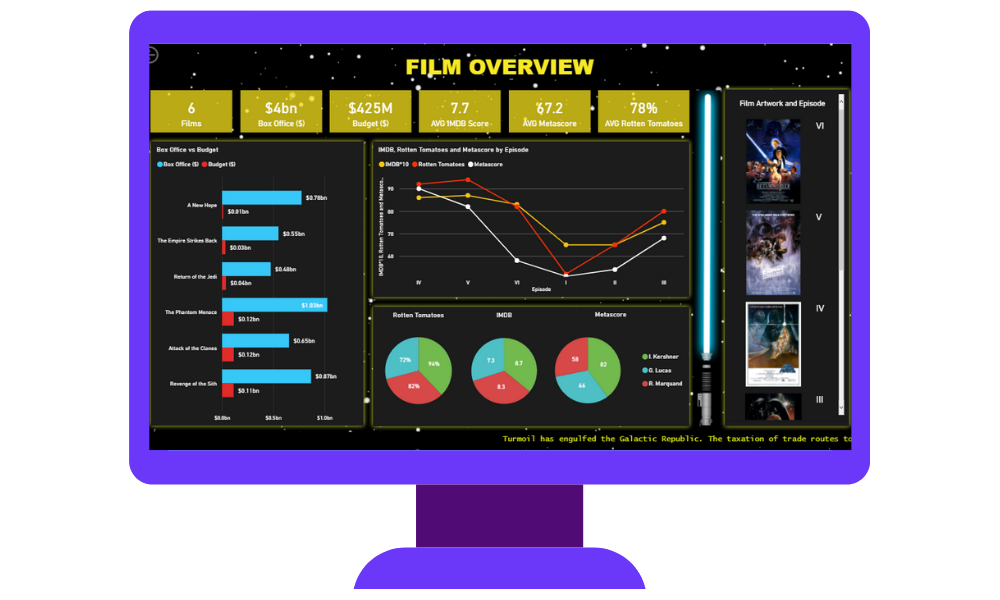
To celebrate May 4th, we decided to delve deep into the minutae of our favourite film saga, Star Wars.
Whether or not you’re a fan of the multi-million dollar franchise, few can deny its monumental success that spans several movies, comic books and video games, and brought us characters and adventures we’ll never forget. One might say there’s only one way to handle so much data…and that’s of course with a Power BI dashboard.
Did you know that out of the first six Star Wars films, the Phantom Menace received the highest box office takings, but has the poorest ratings?
Or that C-3PO, Obi-Wan Kenobi and R2-D2 were the only characters to appear in every one of the first six films?
Explore our interactive dashboard to learn which films had the biggest budgets, which ones won the critics’ approval, and even which starships had the biggest hyperdrive (and crew). Learn fascinating facts about your favourite characters – from Boba Fett’s birth year to Chewbacca’s eye colour. It’s all in there.
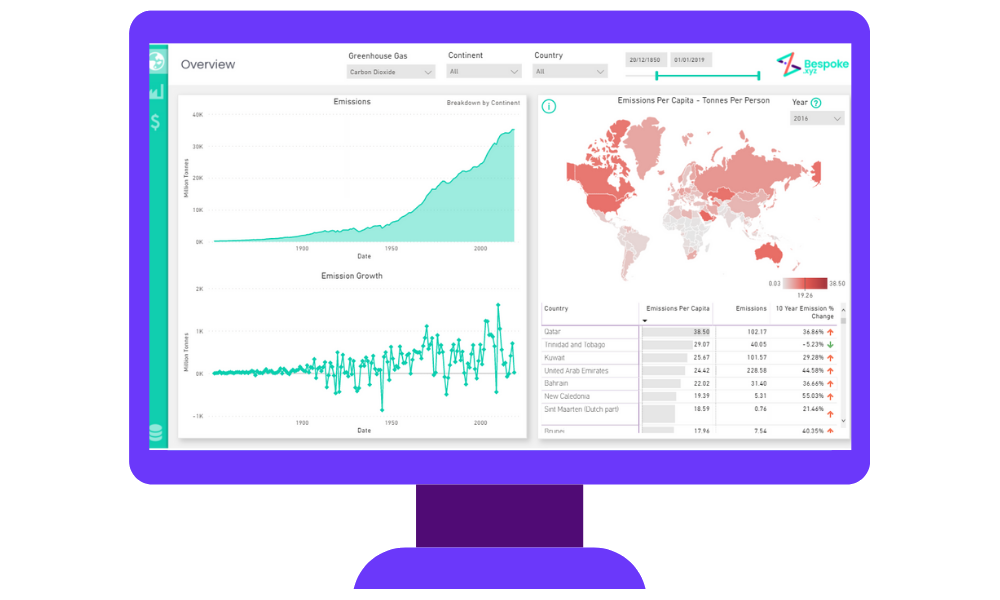
Climate change is a pressing topic at the moment, and rightly so. With global greenhouse gas emissions rising at a worrying rate since the start of the industrial era, and the UN calling for dramatic systematic change, we reckoned there was only one thing to do with all of the scattered data out there – bring it all into one place.
Our GHG emissions data dashboard takes a look at the global impact of three major greenhouse gases: carbon dioxide, methane and nitrous oxide. See which countries have lowered their emissions the most in the last 10 years; which industries are responsible for emitting the most gases, and how the correlation between GDP and emissions has changed over the years – and still continues to change.
This dashboard is full of amazing insights, all of which help us to gain a much-needed clearer picture on the climate crisis.
Hopefully you’ll know by now that data isn’t just a bunch of numbers or observations. Data is a powerful storytelling tool we can use to reveal incredible things about the lives we lead and the world we’re a part of. We can use it to stay informed about important issues, make impactful decisions…and maybe even have a little fun too.
Are you ready to get playful with your data? Get in touch with our team of experts who can help you find new ways to unlock stories about your business.
You’re probably more than familiar by now with Power BI – Microsoft’s cloud-based data visualisation and analytics tool. Whether you’re still on the hunt for a custom data management system or have decided that Power BI is for you, you may still be a little put off at the thought of actually switching.
After all, doesn’t any kind of platform migration typically lead to lengthy delays, overtime hours and unforeseen costs? Well, you just might be wrong about that…
Here, we’re going to take you through the process of switching to Power BI and hopefully put any doubts or concerns you have to rest. In fact, we aim to have you planning the switch by the end of this article!
First, let’s take a quick look at why Power BI has generated so much popularity over the years and is now the leading tool of choice for many of the world’s most iconic brands.
Power BI is an all-in-one solution that can be used to collect, clean and manage data from a wide range of systems and transform it into meaningful insights. As a cloud-based business intelligence service, it can be accessed from almost anywhere, saving time and increasing collaboration for employees and teams. It also saves businesses significant costs in data storage and management, as well as being incredibly secure.
Ultimately, Power BI gives organisations something that’s increasingly important for their success – complete control over their data. Through its many features and capabilities, it gives users an unrivalled 360 degree view of their entire business, opening up the door to market opportunities and saving them both time and money.
There are a number of reasons why switching to Power BI is not like your usual DMS migration. Here are some of the main ones you can look forward to:
Power BI makes it easy to automatically connect your data from various sources immediately after set-up, enabling you to view it all in one place. This means time isn’t wasted migrating data from existing platforms or drawing conclusions from more than one data source.
Power BI’s native integrations include SQL Server, Azure, Google Analytics, Office 365, Microsoft Dynamics, Adobe Analytics, Salesforce, Jira, Mailchimp and many other apps and services your organisation might use. New integrations are always in development too, meaning there’s no limit to the reach Power BI can provide.
Because connecting your data is integral to begin analysing and interpreting, Power BI has made the process as quick and simple as possible. Users can connect their data sources in less than a minute with just a few clicks, to begin making use of the tool’s value straight away.
After selecting the appropriate data sources and entering the relevant credentials, Power BI will automatically populate a dashboard with your real-time data, allowing you to immediately start leveraging its insights. For example, after connecting your CRM system and website analytics software to Power BI, you could create a graph directly comparing website visitors with your sales. Dive further and you could even correlate the average time a visitor spends on your website before making a purchase.
Power BI is built with data governance in mind, so enables you to set user hierarchy and company access permissions from the start.
For instance, users can easily apply specific rules regarding data sources, organisational roles, and individual reports to ensure various kinds of data can be seen only by those who need to see it. To make this process even faster, different levels of administrators can be assigned within Power BI who will also have the power to assign access permissions to everyone else in the organisation. These administrators will be controlled by a Global Admin who can assign different administrators for separate data sources or certain types of data, or whatever else makes sense for your organisation.
All of this makes creating a strong and clear data governance strategy easy from the very beginning.
Power BI is first and foremost a cloud-based platform, but that doesn’t mean customers only have the option of hosting on the cloud. Many businesses are not quite prepared for cloud-based data storage and may want to take less of a leap, in which case Power BI can very much still work for you.
Power BI provides the choice of moving all of your data to the cloud, or perhaps moving just some data while keeping the most important or sensitive stuff on the premises. The Power BI Report server can be used to take reports and dashboards created in Power BI Desktop and deliver them to other browsers and applications, as well as the Power BI mobile app. This allows organisations complete freedom to choose which data they keep on premises and which they decide to put onto the cloud.
There is also the possibility to create hybrid dashboards that use data from both your dedicated server and from behind your own firewall, simply by pinning reports from the Power BI Report Server to the Power BI cloud service.
All of these options enable businesses to transition to the cloud at their own pace and in their own way, while still enjoying the benefits Power BI has to offer.
It’s normal to account for staff training and onboarding time when transitioning to a new data platform. However, Power BI is built to be an intelligent and easy-to-use business tool, with its intuitive drag-and-drop interface and simple set-up process. This is why everyone – from seasoned analytics professionals to absolute beginners – will be able to start turning their data into beautiful, informative visuals and valuable insights within just five minutes.
Power BI’s drag-and-drop interface makes it easy to create data-rich dashboards and engaging charts and graphs. Excel and PowerPoint users can jump right in thanks to its many built-in parallels to and compatibility with these tools, such as the ability to import data from an Excel workbook, drag charts to your dashboard or share the workbook with other Power BI users.
Beyond this, Power BI offers an extensive amount of educational information
you can take advantage of, including official guided tutorials and documentation, webinars, training videos, and other resources, all for free. No matter where your employees are starting from, Power BI provides all the support needed to become a data-led workplace.
Data security may be a concern when moving to a new data management tool – particularly the additional time or costs involved in ensuring data is kept safe throughout the transition process.
Though no cloud-based system is impervious to attacks, it’s worth knowing that Power BI utilises cloud computing service Azure, one of the most stable and secure platforms available. Azure helps to prevent the unauthorized and unintentional transfer of information in several ways, including making use of both a Web Front-End to handle the initial connection and authentication to Power BI, and a Web Back-End cluster, which takes care of all subsequent user interactions.
The Azure infrastructure also uses a multipronged threat-management approach to continuously strengthen its defense and reduce risks. Power BI also comes with the full support and backing of Microsoft, an industry leader in both on-premises and cloud security. This means you can rest assured knowing your data will remain safe.
Ultimately, no other service can compete with Power BI when it comes to usability, features and value. Hopefully we’ll have convinced you that there’s nothing to lose by switching, but if you’re still on the fence, make sure to book a consultation with our Power BI consulting team to see how you can gain control of your data.
Microsoft’s Power BI uncovers data-driven insights in the healthcare industry that can improve clinical decision-making while transforming operations and outcomes.
The Covid-19 pandemic has prompted the healthcare industry to undergo a dramatic change in the way it works, from the reinvention of facilities to providing transparency in patient care.
If nothing else, it’s been a crisis that has forced the industry to think on its feet at a time when it is generating probably more data and insightful information than ever before.
As a result, it’s never been more important to transform this real time data into insightful reports and visualisations – and that’s where Power BI comes in.
A cloud-based analytics service, Power BI provides a fully integrated view of vital data by enabling users to monitor the performance of their business using live dashboards.
It can also generate visual and fully interactive reports with Power BI Desktop, while Power BI Mobile applications allow access to data while on the move.
Users are also presented with interactive data visualisations and business intelligence, giving them a capability for data analytics within a simple-to-use intuitive environment.
Power BI can help healthcare providers make the most of their vital data while offering an economical method for communicating information to those throughout the sector.
By integrating Power BI, providers are able to develop the insights required to limit costs and improve patient care while observing strict compliance rules and regulations.
It can also provide organisations with greater visibility into their data, providing them with greater insights for their key performance indicators by utilising technology.
What’s more the Power BI dashboard allows users to monitor hospital and healthcare quality indicators such as:
Healthcare data can be complicated as organisations and authorities look to track everything from patient satisfaction scores to waiting times to staffing schedules; but Power BI makes it possible to generate detailed, yet easy-to-understand, overviews in order to find pivotal trends.
It can provide timely critical care responses, especially in emergency situations, by empowering healthcare professionals across the board to easily access data, while collaborating, and sharing insights.
By embedding Power BI reports and dashboards within the hospital apps and portals they already use, it can give care teams the data they need for their vital day-to-day decision making – enabling faster reactions and better results.
If that wasn’t enough, it can also safeguard sensitive data using access controls and governance policies which securely provide care teams access to the data they need.
Other Benefits:
Power BI can help providers to constructively use their data while putting the findings into context for everyone from nurses and physicians to executives and administrators – something which had not been possible before.
One of the most economical methods for communicating information to people across the healthcare organisation, it also ensures that high-level data is represented in detail, not to mention a safe and controlled manner.
What’s more, being cloud based, it allows users to keep dashboard reports updated which can then be accessed by numerous employees across a range of devices for greater transparency – even when on the move.
Implementing Power BI could not be easier, allowing providers to reap its many benefits immediately.
The desktop version of Power BI comes at no initial cost with the option to purchase Power BI Pro plan to share capabilities with multiple users while Power BI Premium is available at a slightly greater cost.
What’s more, it’s compatible with other Microsoft products, meaning you can adapt to the software quickly and easily if you’re accustomed to using Office 365 applications.
If you’re a healthcare provider and interested in learning more about how Power BI can help you reduce costs and improve patient care, while adhering to strict compliance regulations, we’re here for you.
Bespoke can help your business get started with Power BI and set you on your way to data-driven success.
We’ve even created a free guide on introducing your company to the Power Platform, including sharing its powerful benefits with decision-makers and stakeholders which you can download here.
So if you think it’s time to embrace the changes brought about by Power BI, contact us today for a demonstration.
Microsoft’s Power BI is making it easier for manufacturers to harness their data in a matter of moments rather than months, increasing productivity and driving their business forward.
But what exactly is it and why should you be making it a focus for 2021?
We’ve outlined everything you need to know about Power BI and how it can benefit you and your business.
Power BI is a business analytics service from Microsoft that provides users with interactive data visualisations and business intelligence, giving them a capability for data analytics within a simple-to-use intuitive environment.
Cloud-based software, it allows multiple users to overlay multiple data sources, analyse data and create impactful visualisations with the aim of driving impact through insight.
What’s more, it also consolidates valuable data, presenting it in an easy-to-digest format, which enables users to make more informed and insightful decisions.
Power BI has the ability to, quite literally, revolutionise how manufacturers engage with their customers while empowering employees to gain insight from big data and optimise their operations – changing the very nature of their business model.
From huge manufacturers to small companies, Microsoft BI is an attachment to the Office 365 package – bringing data to life and providing vital information in a simple-to-understand and easy to access interface.
From identifying opportunities for improvement, trends and patterns to more accurate forecasting, Power BI offers a host of benefits.
So here are just a handful of reasons organisations choose Power BI to meet their self-service and enterprise business intelligence needs.
Power BI allows you to evaluate your supply chain logistics and analyse data regularly to ensure timely deliveries and superior service, helping to keep track of consignment costs while also evaluating performance and negotiating future contracts.
A huge advantage of BI tools is the ability to provide predictive analytics, enabling you to take the necessary actions for improving manufacturing operations; such as scheduling the service of equipment before its condition deteriorates and leads to downtime.
Issues arising in equipment due to poor installation can seriously impact productivity, so maintaining proper functioning of manufacturing operations is vital. The incorporation of data analytics and business intelligence in manufacturing keeps you informed about your machines’ health, while giving you real-time insights into your manufacturing lines.
Demand forecasting is extremely important for every manufacturer in order to plan future production, so if you want to analyse future product demands, Power BI gives you the ability to set up your models so that you can run several scenarios at once, providing you with insights to take your business to the next level.
Power BI creates simplified visualisations of your data that anyone can read and understand at a glance by using official free add-ons, not to mention apps that provide highly customisable graphics – enabling you to digest and present your data as simply or creatively as you wish.
By automating the process of compiling data and connecting it to KPI-centric dashboards, manufacturers are changing the way they do business and intelligence systems like Power BI are making it easier for them.
Power BI allows users to adapt while allowing for more complex, multi data driven and complicated artificial business intelligence-based reporting. Its ability to automate processes and consolidate data also enables decisions to be made faster and more efficiently.
Meanwhile, having access to analytics on the mobile app, alongside tablet and laptop, reduces the time it takes to collate, digest and utilise the information that is so vital to manufacturers.
Implementing this tool couldn’t be easier, meaning you and your business can start to enjoy the many benefits of Power BI almost immediately.
The desktop version of Power BI is totally free with the option to purchase Power BI Pro plan to share capabilities with multiple users while Power BI Premium is available to those with a larger budget.
What’s more, it’s compatible with other Microsoft products, meaning you can adapt to the software quickly and easily if you’re accustomed to using Office 365 applications.
If you’re interested in learning more about how Power BI can impact your manufacturing process, we’re here for you and at Bespoke, we can help your manufacturing business get started with Power BI and set you on your way to data-driven success.
We’ve even created a free guide on introducing your company to the Power Platform, including sharing its powerful benefits with decision-makers and stakeholders which you can download here.
So if you think it’s time for your business to move-on from Excel and get started with Power BI, contact us today for a demo.
Most businesses collect far more data than they ever use. It comes in from your finance system, your CRM, your operations tools and the spreadsheets people keep on their own desktops.
Gathering it is the easy part. Knowing what to do with it is where most organisations get stuck.
So here’s the short answer. There are five things you can actually do with your data:
The rest of this blog takes each one in turn, with the Microsoft tools that make it practical and a sense of what good looks like.
Data on its own does nothing. It sits in storage, costing money, waiting.
It becomes useful the moment it changes something. A decision made with more confidence. An afternoon of manual work saved.
The problem is rarely a shortage of data. It’s that the data lives in too many places, in formats that don’t talk to each other. Getting a straight answer means someone exporting from three systems and stitching it together in Excel by hand, and by the time the report is ready the moment to act has passed.
Everything below closes that gap between having data and getting something out of it.
The most immediate thing you can do with your data is see it clearly.
A dashboard built in Power BI pulls figures from across your systems into one live view, so your sales numbers and your operating costs sit side by side and update on their own. Nobody waits for the monthly report. The people making decisions can see where things stand at any point and act on it.
We worked with Otsuka to move their reporting off Excel and into Power BI. That cut 4 days of manual processing and gave the team that time back for the decisions themselves rather than the spreadsheets behind them.
Good analytics answers the questions you already ask every week, faster and with less doubt about whether the numbers are right.
Once your data is in order, it can do more than report the past. It can give you a fair view of what happens next.
Forecasting reads the patterns in your history and projects them forward: the stock you’ll need next quarter, or the customers drifting towards leaving before they actually go.
Power BI and Microsoft Fabric bring machine learning into this without a data science team on staff, so the modelling runs on your own numbers and updates as new data arrives.
Seeing a shift early gives you room to plan around it, while you still have options.
A lot of what people call working with data isn’t analysis at all. It’s admin.
It’s the low-value handling that fills a working week:
Power Automate takes that off their plate. Invoices get captured and logged without manual entry. Records update across systems the moment something changes. Reports build and send on a schedule with nobody touching them.
We automated our own invoice processing and cut invoice handling time by 60%, taking the approval chasing off people’s desks entirely.
Speed is the obvious gain. The one that matters more is consistency, because work that runs automatically runs the same way every time, and that strips out the small errors that creep in when a person repeats a task a hundred times. Your team gets their hours back, and the data they hand on is cleaner for it.
The newest thing you can do with your data is hand it to an AI agent.
An agent is software that takes a request in plain English and acts on what it finds in your data. Build one in Copilot Studio, connect it to what you already hold in Microsoft 365 and Dynamics 365, and it can draft a proposal from your CRM records or pull a report together from scattered project notes without a person doing the legwork.
This is where organised data pays off twice. An agent is only as good as the data it can reach, so the businesses getting real value from AI tend to be the ones who sorted their data first.
We build custom agents like this in eight days through Agents in 8, working with the systems a business already runs on. We worked with WeChange.AI to build a proposal agent that now saves them 7-10 hours a week and has lifted their win rate by 20%+.
Every use above rests on one thing: your data being in a fit state to use. This is the step that gets skipped, and it’s usually why data projects stall.
In most organisations, data is scattered across systems that were never built to work together. Microsoft Fabric brings it into one place, so your reporting, forecasting, automation and AI all draw on the same trusted source instead of a dozen that disagree.
Get the foundation right first, and everything above gets faster and more reliable. Skip it, and you spend your time explaining why two reports show different numbers.
We did exactly this for a plant hire firm, unifying their data with Microsoft Fabric and Power Platform. It now saves them £97k a year.
This is why Bespoke treats AI, automation and analytics as one conversation. They run on the same foundation, and the businesses that get real value build that foundation first.
In fact, you shouldn’t try.
The organisations that get value from their data usually start with one problem worth solving. A report that eats a day every month. A forecast nobody trusts.
You don’t need a big budget or a rip-and-replace project to begin either. Most of this runs on Microsoft licences you’re probably already paying for, working alongside your current systems rather than replacing them.
The harder part is knowing which problem to start with and what it’ll actually take. That’s what a Triple A Assessment is for: a one-day engagement that looks across your AI, automation and analytics options and hands you a ranked list of where the value is and a clear first step.
If your data is doing less than it should, that’s the place to start.
In a business, you use it to make decisions and remove work. That means reporting on how you’re performing, forecasting what’s ahead, automating the manual handling and, increasingly, feeding it to AI agents that act on it. On its own data does nothing. It earns its place when it changes a decision or saves someone time.
The main uses fall into five groups: reporting and dashboards, forecasting and prediction, automating manual processes, powering AI agents and unifying scattered data into one reliable source. Most data projects are a version of one of these.
The same things larger ones can, at a smaller scale. One dashboard pulling sales and costs into a single view, or an automation that handles invoicing, can be built without a big team or budget. Start with one clear problem.
Pick one problem worth solving rather than launching a broad data programme. A Triple A Assessment is a one-day way to see where the value is across AI, automation and analytics and leave with a ranked first step.