Get a callback from our team within 20 minutes during business hours.

Okay, we’ve chatted about Power BI time and time again – you’re probably well familiar with its incredible features by now.
But just in case you need to hear it from the horse’s mouth, our Business Development Director, Jordan Brookes, is here to share his seven key reasons why you should adopt the Power BI platform.
Always keen to leverage the newest technology to stay ahead of the curve, Jordan is a fan of Power BI for enabling us to better serve our clients. Here’s how using it could help you do the same…
With all your data in one place, Power BI has the power to unlock invaluable insights about your business – from monitoring product sales to finding gaps in organisational processes.
By compiling all your data from various platforms and channels and turning it into easy-to-read, intuitive visualisations, all employees on every level will be able to make data-led, impactful decisions. Because Power BI is so easy to use, it doesn’t require a data analyst or an IT professional to access and manage it, meaning everyone within the business can feel empowered and closer to the heart of the action.
Getting started with Power BI dashboards is quick and uncomplicated, meaning there’s no waiting around to see that precious ROI.
For example, all of your data sources can be connected to Power BI in less than a minute, meaning there’s no lengthy set-up process. With in-built integrations such as Excel, Salesforce, Google Analytics, Jira and much more, you can have all your data in one place from the get-go.
When it comes to getting individual users set up, Power BI makes it easy to set up user levels and access permissions, so long as you have a good idea of your data governance strategy ahead of time. And thanks to its incredibly intuitive dashboard and drag-and-drop interface, almost anyone can start using Power BI straight away, without the need for additional training beforehand. If they get stuck, all of Power BI’s educational resources are available for free.
Power BI’s dashboards can be accessed from any laptop, tablet or phone, meaning you can keep your eye on emerging trends wherever you are. This also helps to keep employees in the loop, with the option to share with team-mates or clients on the move.
If you’re concerned about the security risks of accessing sensitive data over a mobile connection, know that the Power BI mobile app comes with full Enterprise Mobility and Security compatibility, meaning you can rest easy knowing your company information stays safe. You also have the option of using Power BI’s flexible permission controls, so only those who need to know certain information can access it from their mobile devices.
Part of the beauty of Power BI is that data sources can be pushed into dashboards in real-time, meaning users can make meaningful decisions based on the most accurate data.
This is incredibly important for conserving time and resources, as out-of-date, inaccurate, or missing data can mean employees need to go searching for the right data before they can move forward. It also enables employees to act quickly within periods of pressure or high demand, limiting the possibility of making decisions that could do more harm than good.
Gone are the days when data needs to be manually downloaded, before reuploading it to another platform in order to be cleaned, processed or visualised. Power BI does this all in one go by staying permanently connected to your data sources, meaning you’ll never have to download a dataset again.
Simply jump in, see your data in real-time and start discovering its potential.
Power BI comes with no upfront costs, so you can get started using Power BI desktop directly without any obligation or license fees. This means you can take your time finding your feet and creating your first report, seeing how Power BI could benefit your business before making a commitment.
If and when you’re ready to level up, know that Power BI Pro still costs two to three times less than its leading competitors, with the option to add additional data capacity without purchasing extra license fees (if over 1000 users).
For more advanced users, Power BI can be used to streamline various processes with its artificial intelligence features. These include image recognition, text analytics and machine learning integration directly from within the platform.
All these new AI capabilities were pioneered in Azure and require no code, enabling all Power BI users to discover hidden, actionable insights in their data and drive better business outcomes.
At Bespoke, we help businesses like yours unlock the full potential of their data through custom solutions, including Microsoft Power BI. Talk to the team today to learn more about Power BI and how we can help you with one of our friendly Power BI consultants.
To those less in-the-know, data can easily come off as being quite a dry subject. Numbers? Graphs? Comparisons? Without the tools to understand or manage data’s complexities, it can all seem a little overwhelming.
But when you have the power to unlock the stories data tells, it opens up a whole door of exciting narratives and intriguing discoveries. And the data can be about anything – from your favourite TV show to how you like to organise your spending.
Here at Bespoke, we’ve been having some fun with data lately. Take a look at the three Power BI dashboard examples below created with Microsoft Power BI, which share some pretty thrilling insights…
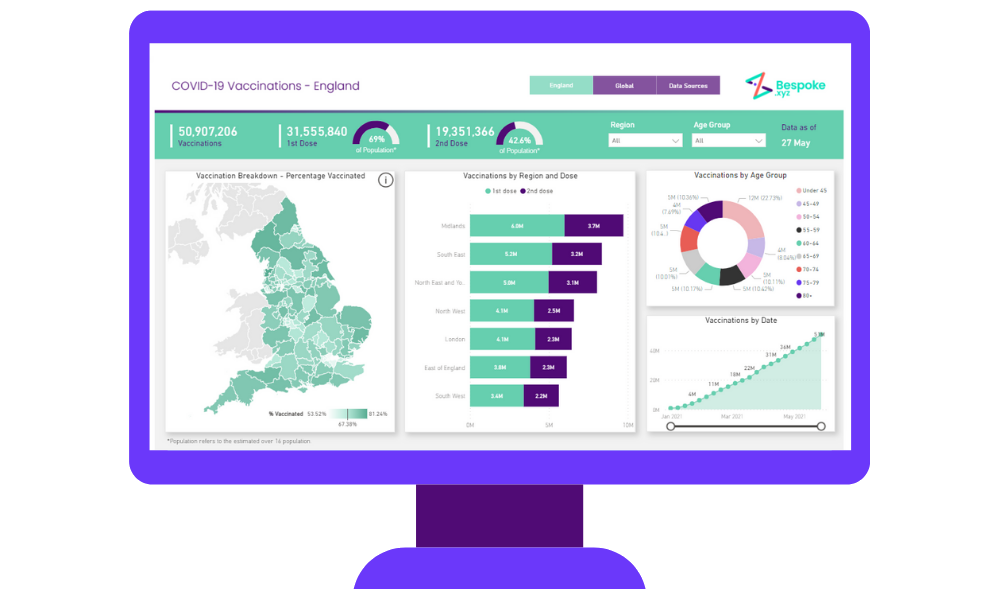
We’re sure you’ll agree that everyone is keeping a close eye on the UK’s covid-19 vaccination rollout right now. We decided to compile all the current stats on vaccinations in this easy-to-view Power BI dashboard, so you can stay close to the action as it unfolds.
The map on the left gives a top-down view of the most vaccinated areas in the UK, while the filters in the top right enable you to check the progress of vaccinations in your local area and by age.
Flip on over to the second page and we can compare the UK’s progress with the rest of the world, checking out the most vaccinated countries and seeing the number of vaccination doses administered so far.
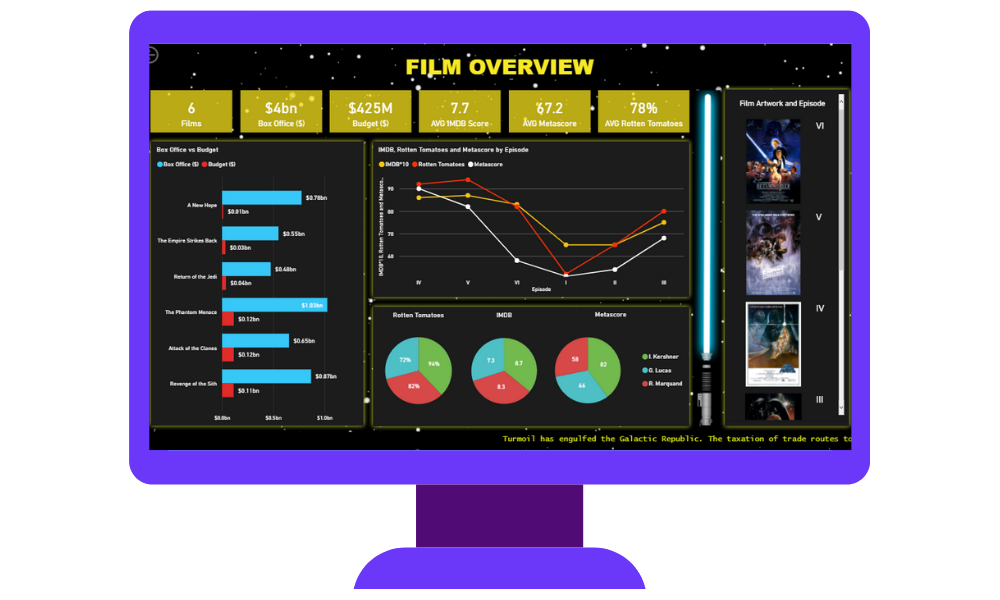
To celebrate May 4th, we decided to delve deep into the minutae of our favourite film saga, Star Wars.
Whether or not you’re a fan of the multi-million dollar franchise, few can deny its monumental success that spans several movies, comic books and video games, and brought us characters and adventures we’ll never forget. One might say there’s only one way to handle so much data…and that’s of course with a Power BI dashboard.
Did you know that out of the first six Star Wars films, the Phantom Menace received the highest box office takings, but has the poorest ratings?
Or that C-3PO, Obi-Wan Kenobi and R2-D2 were the only characters to appear in every one of the first six films?
Explore our interactive dashboard to learn which films had the biggest budgets, which ones won the critics’ approval, and even which starships had the biggest hyperdrive (and crew). Learn fascinating facts about your favourite characters – from Boba Fett’s birth year to Chewbacca’s eye colour. It’s all in there.
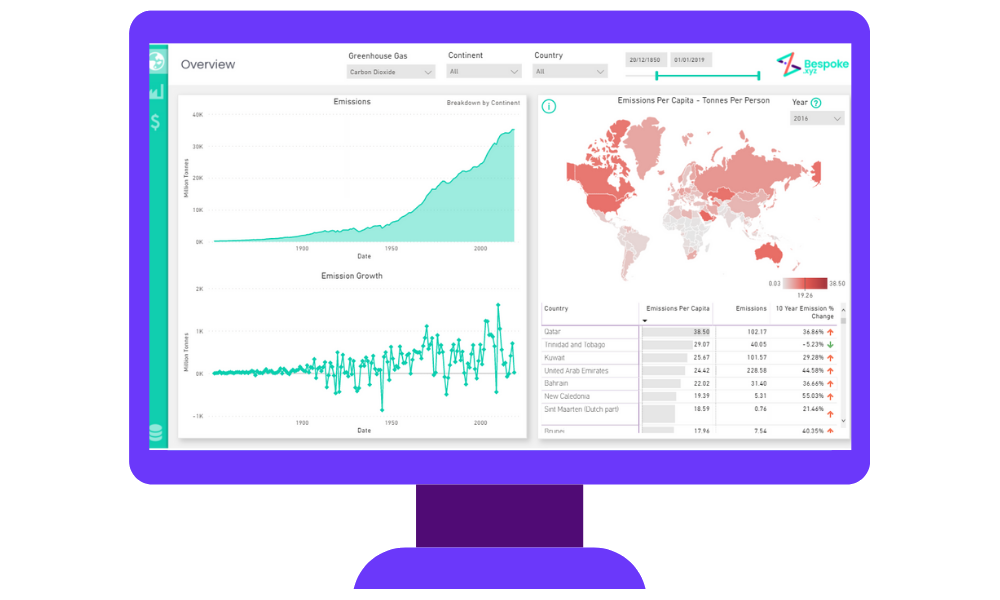
Climate change is a pressing topic at the moment, and rightly so. With global greenhouse gas emissions rising at a worrying rate since the start of the industrial era, and the UN calling for dramatic systematic change, we reckoned there was only one thing to do with all of the scattered data out there – bring it all into one place.
Our GHG emissions data dashboard takes a look at the global impact of three major greenhouse gases: carbon dioxide, methane and nitrous oxide. See which countries have lowered their emissions the most in the last 10 years; which industries are responsible for emitting the most gases, and how the correlation between GDP and emissions has changed over the years – and still continues to change.
This dashboard is full of amazing insights, all of which help us to gain a much-needed clearer picture on the climate crisis.
Hopefully you’ll know by now that data isn’t just a bunch of numbers or observations. Data is a powerful storytelling tool we can use to reveal incredible things about the lives we lead and the world we’re a part of. We can use it to stay informed about important issues, make impactful decisions…and maybe even have a little fun too.
Are you ready to get playful with your data? Get in touch with our team of experts who can help you find new ways to unlock stories about your business.
Microsoft’s Power BI uncovers data-driven insights in the healthcare industry that can improve clinical decision-making while transforming operations and outcomes.
The Covid-19 pandemic has prompted the healthcare industry to undergo a dramatic change in the way it works, from the reinvention of facilities to providing transparency in patient care.
If nothing else, it’s been a crisis that has forced the industry to think on its feet at a time when it is generating probably more data and insightful information than ever before.
As a result, it’s never been more important to transform this real time data into insightful reports and visualisations – and that’s where Power BI comes in.
A cloud-based analytics service, Power BI provides a fully integrated view of vital data by enabling users to monitor the performance of their business using live dashboards.
It can also generate visual and fully interactive reports with Power BI Desktop, while Power BI Mobile applications allow access to data while on the move.
Users are also presented with interactive data visualisations and business intelligence, giving them a capability for data analytics within a simple-to-use intuitive environment.
Power BI can help healthcare providers make the most of their vital data while offering an economical method for communicating information to those throughout the sector.
By integrating Power BI, providers are able to develop the insights required to limit costs and improve patient care while observing strict compliance rules and regulations.
It can also provide organisations with greater visibility into their data, providing them with greater insights for their key performance indicators by utilising technology.
What’s more the Power BI dashboard allows users to monitor hospital and healthcare quality indicators such as:
Healthcare data can be complicated as organisations and authorities look to track everything from patient satisfaction scores to waiting times to staffing schedules; but Power BI makes it possible to generate detailed, yet easy-to-understand, overviews in order to find pivotal trends.
It can provide timely critical care responses, especially in emergency situations, by empowering healthcare professionals across the board to easily access data, while collaborating, and sharing insights.
By embedding Power BI reports and dashboards within the hospital apps and portals they already use, it can give care teams the data they need for their vital day-to-day decision making – enabling faster reactions and better results.
If that wasn’t enough, it can also safeguard sensitive data using access controls and governance policies which securely provide care teams access to the data they need.
Other Benefits:
Power BI can help providers to constructively use their data while putting the findings into context for everyone from nurses and physicians to executives and administrators – something which had not been possible before.
One of the most economical methods for communicating information to people across the healthcare organisation, it also ensures that high-level data is represented in detail, not to mention a safe and controlled manner.
What’s more, being cloud based, it allows users to keep dashboard reports updated which can then be accessed by numerous employees across a range of devices for greater transparency – even when on the move.
Implementing Power BI could not be easier, allowing providers to reap its many benefits immediately.
The desktop version of Power BI comes at no initial cost with the option to purchase Power BI Pro plan to share capabilities with multiple users while Power BI Premium is available at a slightly greater cost.
What’s more, it’s compatible with other Microsoft products, meaning you can adapt to the software quickly and easily if you’re accustomed to using Office 365 applications.
If you’re a healthcare provider and interested in learning more about how Power BI can help you reduce costs and improve patient care, while adhering to strict compliance regulations, we’re here for you.
Bespoke can help your business get started with Power BI and set you on your way to data-driven success.
We’ve even created a free guide on introducing your company to the Power Platform, including sharing its powerful benefits with decision-makers and stakeholders which you can download here.
So if you think it’s time to embrace the changes brought about by Power BI, contact us today for a demonstration.
Power FX is to be the new low-code language that will be used to express logic across the entire Power Platform. This language is inspired by Microsoft Excel, and currently underpins canvas Power Apps. When going into detail about what Power FX is and does, they advised people to ‘think Excel’, given that its creation was inspired by the idea that apps should be built as easily as spreadsheets.
As a business that originated as Excel experts, before becoming Power Platform specialists, you can imagine how excited we are by this news! It’s not difficult to see where the name ‘Power Fx’ came from, just go and take a look at an Excel formula bar.

Given that hundreds of people create spreadsheets with Excel every day, Microsoft wanted to make app creation easier for all whilst leveraging people’s existing spreadsheet knowledge. The founding team’s original aspiration was to craft a language that achieved the following:
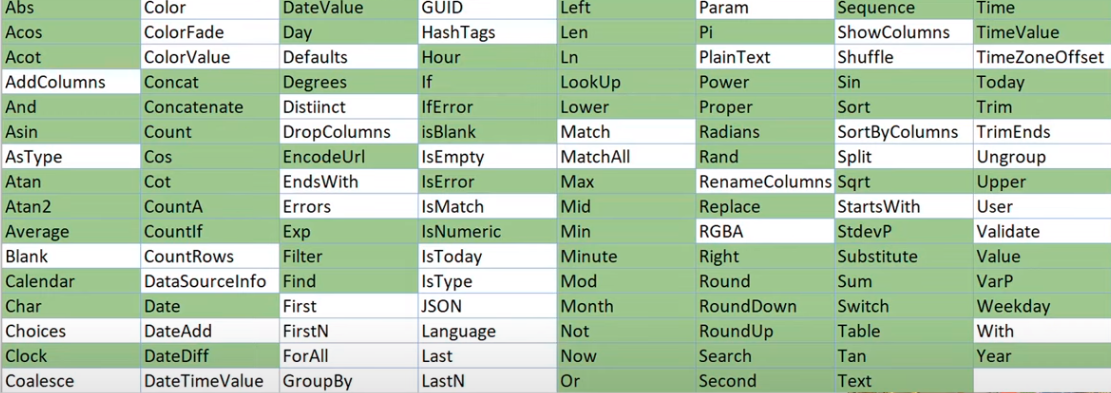
The table below shows the functions in green which are identical or very close to Excel’s version, emphasising the fact that Power Fx’s roots are firmly cemented in Excel.
Microsoft have confirmed that the roll out of Power FX will be phased over a 24 month period, and by the end of 2021, Power FX will be rolled out to:
Beyond 2021:
Power Apps users – nothing! Expression language is currently used in canvas Power Apps and this is essentially Power FX, so what is currently in place will remain, but we’re likely to see this enhanced over time.
Power BI users – need not worry that this will replace M or DAX – Power FX has been created to complement these.
Power Automate users – no effect right now, likely to start seeing it rolled out to Power Automate in around 18 months.
Dataverse/Model Driven App & Power Virtual Agents users – Microsoft plan on rolling Power FX out to these environments first, so it is recommended that developers quickly familarise themselves with the syntax currently used in Excel and Canvas Apps.
By using a syntax synonymous with that used in Excel, Power Fx will allow users to build Apps as easily as Excel spreadsheets. In addition, it also means there is much more consistency across Power Apps and Power Automate, making the development of Power Platform solutions far more efficient.
Microsoft have highlighted three main reasons why the introduction of Power FX is so exciting:
Using formulas that are already familiar to hundreds of millions of users means that Power FX becomes common ground for both business users and professional developers
It is already the foundation of Power Apps canvas, and once rolled out across the whole of the Power Platform, people will be able to get started with low-code solutions much faster
Microsoft recognise that the future of programming is open source and have embraced the pace of open innovation that has propelled the adoption of languages such as Typescript and C#. By making Power FX available for open contribution from the broader community, Power FX will naturally evolve for the better over time
Probably the most exciting thing about Power FX to us, is that it is ALWAYS LIVE! Again, this is another Excel trait which has been adopted, as it allows immediate feedback. Excel doesn’t have an edit/compile/run state – you simply load the spreadsheet, edit your formulas and values freely, and you get your answers – simple. A spreadsheet is always live, and there is no distinction between editing and running. Any errors detected come to light immediately and don’t interfere with the rest of the spreadsheet. Well, the people behind Power Fx want their users to have this same live experience. As developers, this means we will now have the advantage of telling the app what we want it to do, without having to describe the how or when, meaning we won’t have the tedious task of keeping variables and data tables up-to-date manually – therefore, Power Fx will allow us to build solutions faster, which is, well, bloody marvellous news!
The introduction of Power Fx paves the way for businesses that are powered by offline legacy spreadsheets, to be migrated to cloud-based solutions that are multi-user, single version, scalable deployments. Not only that, because Power Fx is based on Microsoft Excel, using the Power Platform for their business intelligence requirements will be less daunting, as they will already be familiar with elements of it, therefore the Power Platform adoption process will be quicker and a return on their investment will be seen much sooner. What better way to kickstart a Digital Transformation journey!
To find out how your business can benefit from Power Fx and the Power Platform, get in touch.
My role is extremely varied but ultimately it is to ensure the smooth and successful delivery of all our projects, from initial customer engagement through to project management and technical/development consultancy. I also work as a Senior Project Manager on large, key accounts as well as manage our development/technical specialists and projects team in terms of resource management, staff performance and training.
I have worked in the IT industry for many years and my previous roles have been in Service and Project Delivery including PMO, Project Manager and Service Delivery Manager within software and hardware deployments, including hosted migrations, upgrades and new product platforms.
Having the opportunity to work with amazing technical and non-technical specialists in their field inspires me. There is always something new to learn when surrounded by a team of passionate and creative people!
Bespoke may be a small company but with a huge personality and this shows in the team chemistry.
Managing a team that work so well together and watching those technical sparks fly when a new project gets started. Knowing that everyone is committed to deliver a quality product and that they not only support each other, but all pull together when the pressure is on.
Engaging with clients at the beginning of each new project and watching their vision come to life throughout the duration of their project and the successful result and client satisfaction with the finished product.
The successful delivery of multiple excel-based projects to a global audience for STEM Healthcare and now on a digital transformation journey with them using the Power Platform.
Initially I found transitioning from a large formal company a challenge, but I soon saw the benefits of working with less red tape, fewer people, and departments to consider. There is far more flexibility in terms of project deployment and when working with a small team, as decisions are made faster and communication, as well as the team bond, is stronger.
Keeping staff and projects going through the pandemic has been incredibly challenging.
My day starts with a meeting with the team to communicate the work to be delivered that day and to check in to make sure everyone has what they need to have a successful day.
The remainder of my day is split between project meetings both internally and externally, following up on project actions and planning, resource planning and staff management.
Now more than ever businesses will have a greater need to save on time and costs and they will continue to look at ways of reducing and simplifying manual one person tasks or processes.
The next 10 years will definitely be an exciting time for technology, as it will continue to be as fast paced as it is now, but with even more on offer, especially around Data Analytics, AI and Cloud computing, and who knows maybe even a robot as a team member!
A personalised virtual help seeker/assistant! A bit like Siri but better! Something that could be dropped in and deployed into any system (regardless of the system) and could help find supporting documents, reach out to a team member or client, create meetings, make notes as well as help clients troubleshoot quickly and easily on our products, make suggestions, and recommend who to contact etc.
Personal – learn a new language or learn to play golf (the number of times I have been asked how I can originally be from St Andrews ‘the home of golf’ and not play) Work – something technical – code or Power Apps development.
Borneo as I would love to visit the orangutan’s sanctuary!
Spanish as it is widely recognised/spoken in over 22 countries across the world and that has got to be a good excuse to travel (when we can!)
Read more about the team and Bespoke’s story here.
You’ve probably heard the saying, “It’s not what you have, it’s how you use it.” Never is this potentially more true than when we’re dealing with data.
Data is a collection of facts and information turned into a form that’s easier for us to process. It can be numbers, words, measurements or even just observations. Consumer data often holds many insights about your customers – from what they like to buy to how or even when – and can help us build more positive customer relationships.
Gathering consumer data, however, is only one part of the equation – what matters most is how you use it. In today’s tech-led world we are being overwhelmed with data, and if you don’t know what to do with it, your competition will.
Here at Bespoke, we help businesses efficiently process their data to unlock powerful advantages. We do this in five ways:
Data transformation involves changing the format, structure, or values of raw data in order to make it easier to process (see below). It may be constructive (like adding or replicating data), destructive (deleting records and folders), aesthetic (standardising values and labels), or structural (such as moving and combining columns in a database).
We transform data to make it more organised and easier for both humans and computers to use. It helps to improve data quality later down the line (see Data Validation) and protects against potential problems like null values, unexpected duplicates or incompatible formats.
Data transformation might also include data integration – the combination of technical and business processes to combine data from various sources into meaningful and valuable information.
All of these transformative processes are crucial to effective data management, which is the practice of collecting, keeping and using data securely and cost-effectively.
More data of course means more processing, which can significantly add to your company’s workload. That’s where data automation comes in.
Data automation allows mundane data handling tasks to be run effortlessly in the background, without demanding precious employee time. It can be achieved using business applications such as Excel and Power BI, or even a bespoke solution created specifically for you.
Different types of data automation might include data capture automation (making it easier to collect, store and organise large amounts of data at once); automating business processes or workflows, and automated data uploads (leading to increased accuracy and saved time).
Data visualisation is the presentation of data in a graph, chart, diagram or other visual format. It is incredibly important for business dashboards as a way to communicate relationships between the data and allow trends and patterns to be easily seen. Machine learning makes it easier to conduct business analytics such as predictive analysis, which can then serve as helpful insights for future goals.
Data virtualisation, meanwhile, allows an application to retrieve and manipulate data without requiring technical details such as the data’s format or physical location. Similar to data visualisation, the goal of data virtualisation is to create a single representation of data from multiple, disparate sources, without having to copy or move the data.
Data processing is when data is collected and translated into usable information. It is important for this to be done correctly so as to avoid negatively affecting the end data or product.
Starting with the data in its rawest form, data processing converts it into a more readable format (such as a graphs or documents, etc.), enabling company employees and stakeholders to utilise the data for their own data analytics projects.
This type of information processing is typically done using machine learning algorithms, though the process may vary depending on the source of data being processed and its intended use.
Data validation involves checking the accuracy and quality of source data before using, importing or otherwise processing data. When moving and merging data from different sources and repositories, it’s important to make sure it conforms to business rules and doesn’t become corrupted due to inconsistencies. The goal is to create data that is consistent, accurate and complete, to prevent data loss and errors during a move.
Different types of validation depend on destination constraints or objectives. Data validation is also a form of data cleansing.
At Bespoke, we have a team ready to help you prepare to work with your data and understand the opportunities available and even do a data healthcheck. Just shoot us an email to set up your free consultation.